Ch. 4 Continuous Random Variables and Probability Distributions
Sections covered: 4.1, 4.2, 4.3, 4.4 (exponential only)
R
Simulating a uniform distribution
Randomly choose one number from the distribution:
\(f(x) = .2\) for \(0 \leq x \leq 5\), 0 otherwise.
runif(n = 1, min = 0, max = 5)## [1] 4.256449Take the average of 1000 picks:
## [1] 2.539618Draw a histogram of the 1000 picks:
hist(x, las = 1, col = "lightblue")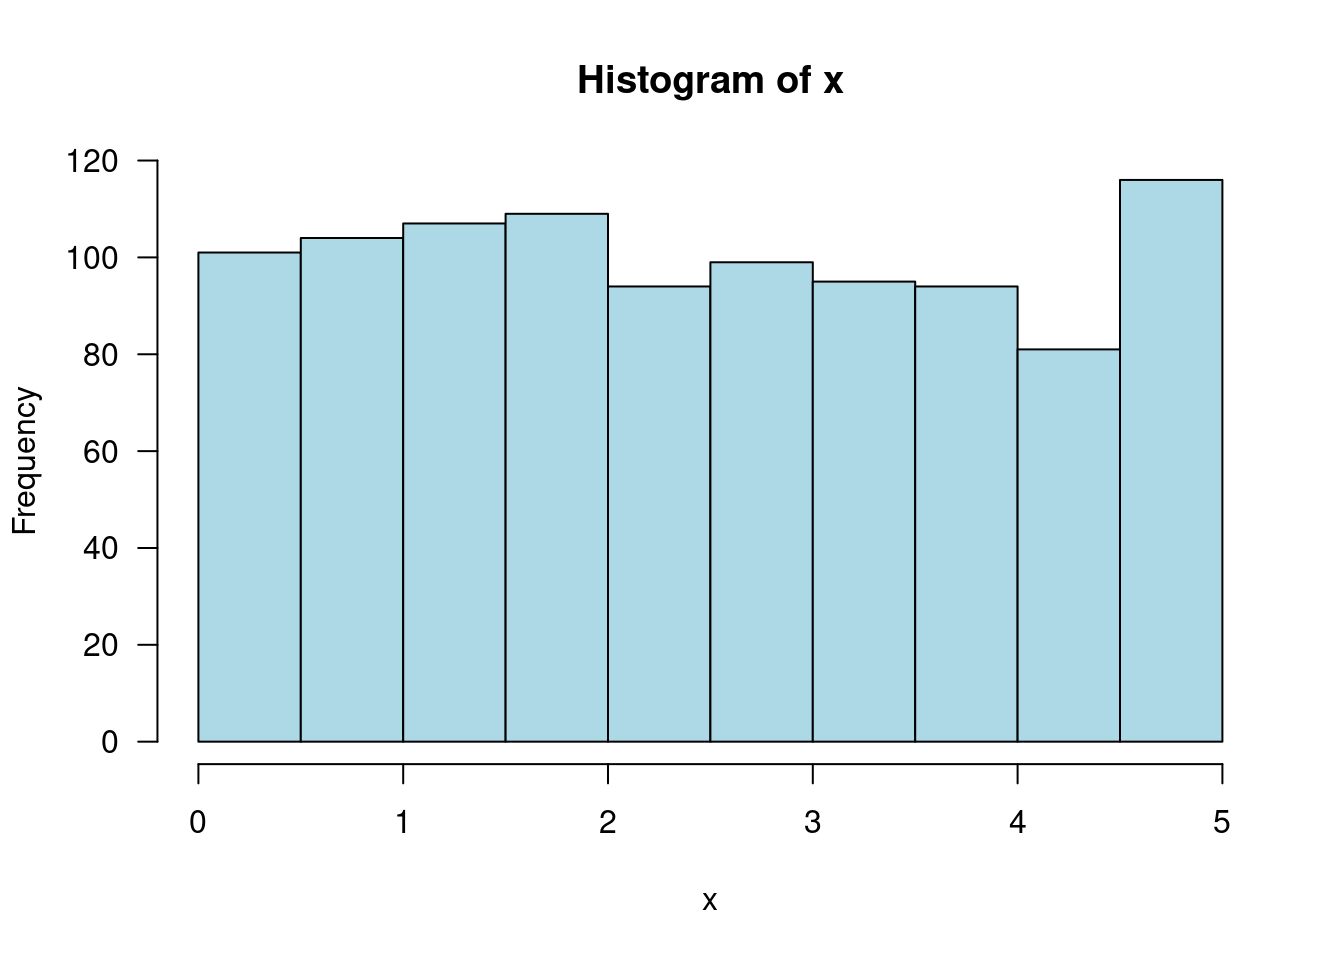
4.2 Cumulative Distribution Functions and Expected Values
Using R to help with calculations in Example 4.7, p. 149
Define a function for the cdf (you have to do the integration yourself):
F <- function(x) (x/8) + (3/16)*x^2Find \(F(1.5) - F(1)\)
## [1] 0.2968754.3 The Normal Distribution
Interactive normal distribution – change \(\mu\) and \(\sigma\) and see what happens.
Normal table – in pdf form for viewing online, downloading and/or printing
Online normal distribution lookup – enter \(z\) and it will calculate \(F(z) = P(Z \leq z)\).
There are many online normal distribution calculators. Note that often you are given the choice of finding \(P(Z \leq z)\), \(P(Z \geq z)\), \(P(0 \leq Z \leq z)\), etc., so be careful. To be consistent with the normal tables in the textbook / class, choose \(P(Z \leq z)\).
Due to rounding differences in \(z\) and \(P(Z \leq z)\), solutions using technology will vary from those using a normal table. Both methods are fine.
R
\(P(Z \leq -1)\)
Unless specified otherwise, pnorm uses a mean of 0 and standard deviation of 1 (standard normal).
pnorm(-1)## [1] 0.1586553\(P(X \leq 37)\) given \(\mu = 40\) and \(\sigma = 2\)
pnorm(37, mean = 40, sd = 2)## [1] 0.0668072or
pnorm((37-40)/2)## [1] 0.0668072\(P(X > 39)\)
1 - pnorm(39, mean = 40, sd = 2)## [1] 0.6914625Find the 75th percentile for the standard normal distribution:
qnorm(.75)## [1] 0.6744898Find the 75th percentile for a normally distribution population with mean 40 and standard deviation 2:
qnorm(.75, mean = 40, sd = 2)## [1] 41.34898or
40 + qnorm(.75)*2## [1] 41.34898Practice Exercises
-
(pdf, E and V) \(X\) is a continuous random variable with probability distrbution \(f(x)=.06x + .05\) where \(0\leq x \leq 5\).
- What is the probability that \(2\leq x\leq 4\)?
- What is the probability that \(x = 4\)?
- What is the expected value of \(X\)?
- What is the variance of X?
[Ans] a. Integrating by hand: \(f(x)=.06x + .05\), we get \(F(x) = .03x^2+.05x\).
## [1] 0.460
Integrate \(x\cdot f(x) = x(.06x+.05)=.06x^2+.05x\), we get \(H(x) = .02x^3+.025x^2\).
H <- function(x) 0.02*x^3 + 0.025*x^2
H(5)-H(0)
## [1] 3.125- \(V(X) = E(X^2)-[E(X)]^2\). Integrate \(x^2\cdot f(x) = x^2(.06x+.05)=.06x^3+.05x^2\), we get \(G(x) = .015x^4+\frac{.05}3x^3\).
E <- H(5)-H(0)
G <- function(x) .015*(x^4)+(.05/3)*(x^3)
G(5)-G(0)-E^2
## [1] 1.692708-
(Standard Normal,
pnorm) A driver’s reaction time for an in-traffic response to a brake signal can be modeled with a normal distribution having mean value 1.25 sec and standard deviation of .46 sec. (Textbook 4.16)What is the probability that reaction time is between 1.00 sec and 1.75 sec?
What is the probability that reaction time exceeds 2.00 sec?
## [1] 0.5680717
1 - pnorm((2-1.25)/0.46)## [1] 0.05150482
# alternatively
pnorm(-(2-1.25)/0.46)
## [1] 0.05150482-
(Nonstandard Normal,
qnorm) Data collected from an experiment with a specified initial crack length propose a normal distribution with mean value 5.496 mm and standard deviation .067 mm. For this model, what value of final crack depth would be exceeded by only .5% of all cracks? (Textbook 4.18)
qnorm(0.995, 5.496, .067)## [1] 5.668581- (Binom Appproximation) Suppose that 25% of all students at a large public university receive financial aid. Let \(X\) be the number of students in a random sample of size 50 who receive financial aid, sothat p = .25. What is the probability that at most 10 students receive aid? (Textbook 4.20)
# binom distribution calculation
pbinom(10, size = 50, prob = 0.25)
## [1] 0.2622023## [1] 0.2568146